Private School vs. Public School Data + Analysis
Purpose: This page's goal is to help people research the demographics and financial details of private schools compared to public schools. The page will have tables, figures, and comments to illustrate how the application rates and costs differ between private vs. public schools.
Data Sub-Genre Focus: Comparing Private vs. Public College Student Demographics and Financials
Resources


| private |
apps |
accept |
enroll |
top10perc |
top25perc |
f_undergrad |
p_undergrad |
outstate |
room_board |
books |
|---|---|---|---|---|---|---|---|---|---|---|
| Yes |
1130 |
704 |
322 |
14 |
23 |
1586 |
326 |
9996 |
3090 |
900 |
| No |
3540 |
2001 |
1016 |
24 |
54 |
4190 |
1512 |
5130 |
3592 |
500 |
| Yes |
713 |
661 |
252 |
25 |
44 |
712 |
23 |
15476 |
3336 |
400 |
| No |
7313 |
4664 |
1910 |
20 |
63 |
9940 |
1035 |
6806 |
2540 |
96 |
| Yes |
619 |
516 |
219 |
20 |
51 |
1251 |
767 |
11208 |
4124 |
350 |
| No |
12809 |
10308 |
3761 |
24 |
49 |
22593 |
7585 |
7434 |
4850 |
700 |
| Yes |
708 |
334 |
166 |
46 |
74 |
530 |
182 |
8644 |
3922 |
500 |
| No |
1734 |
1729 |
951 |
12 |
52 |
3602 |
939 |
3460 |
2650 |
450 |
| Yes |
2135 |
1700 |
491 |
23 |
59 |
1708 |
689 |
12000 |
5920 |
500 |
| No |
7548 |
6791 |
3070 |
25 |
57 |
16262 |
1716 |
6300 |
3933 |
600 |
| Yes |
662 |
513 |
257 |
12 |
30 |
2074 |
726 |
11902 |
4372 |
540 |
| Yes |
1879 |
1658 |
497 |
36 |
69 |
1950 |
38 |
13353 |
4173 |
540 |
| Yes |
761 |
725 |
306 |
21 |
58 |
1337 |
300 |
10990 |
3244 |
600 |
| Yes |
948 |
798 |
295 |
42 |
74 |
1120 |
15 |
11280 |
4342 |
400 |
| Yes |
627 |
556 |
172 |
16 |
40 |
777 |
538 |
9925 |
4135 |
750 |
| Yes |
602 |
483 |
206 |
21 |
47 |
958 |
466 |
8620 |
4100 |
400 |
| Yes |
1690 |
1366 |
662 |
30 |
61 |
2718 |
1460 |
10995 |
4410 |
1000 |
| Yes |
261 |
192 |
111 |
15 |
36 |
453 |
266 |
9690 |
4300 |
500 |
College Student Statistics
- private
- Whether the school is a private school or public school.
- apps
- How many applications the college got that year.
- accept
- How many students total were accepted into the college.
- Enroll
- How many accepted students enrolled in the college.
- top10perc
- The number of students attending who are in the top 10% in regards to their high school class.
- top25perc
- The number of students attending who are in the top 25% in regards to their high school class.
- f_undergrad
- The number of full-time students attending the college.
- p_undergrad
- The number of part-time students attending the college.
- outstate
- The tuition for out of state students attending the college.
- room_board
- Cost of room and board for the college.
- books
- Estimated annual cost of books for the college.
Closer Look
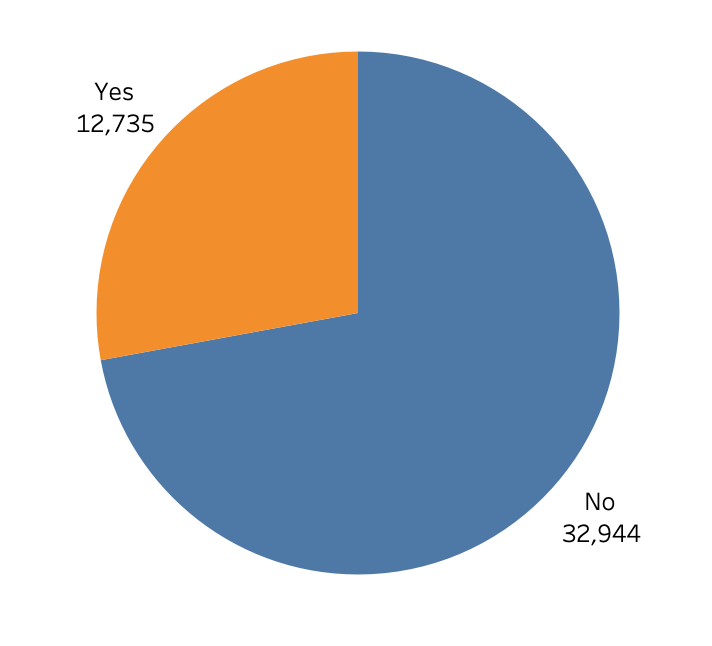
The total number of applications for private schools, 12,735 applications, is much smaller than the total number of applications for public schools, 32,944 applications. Out of a total of 45,679 applications, the private school applications make up 27.88%. This is despite the fact that there are more private schools on this table than public schools, meaning there is quite a significant difference in the amount of applicants between the two types of colleges.
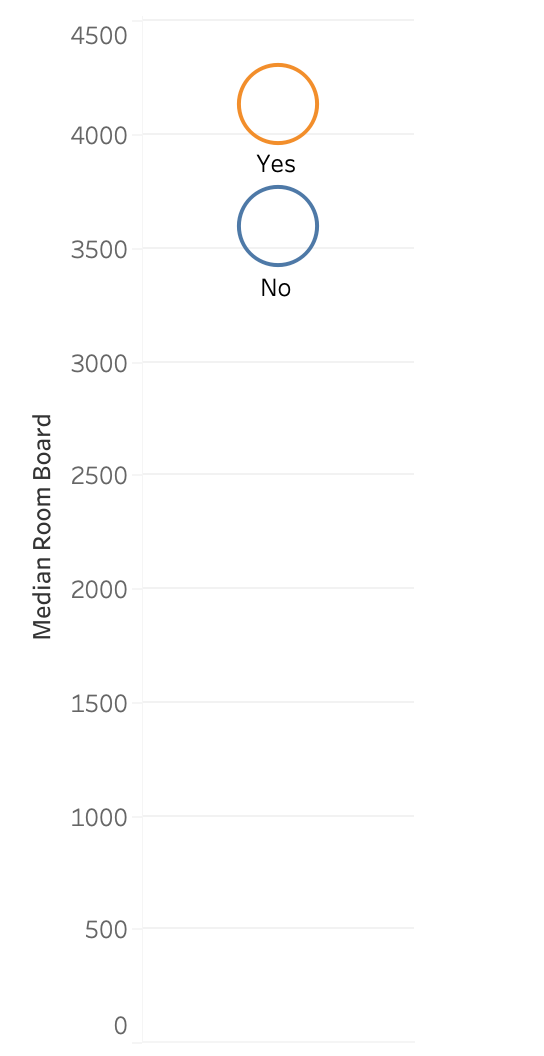
The median cost for the private schools’ room and board, around $4200, is much higher than the median of public schools’ room and board, around $3700. This could be related to the fact that they get less applicants in general, and thus need to charge more to reach the same profits public schools get. If less people go to the school, less people require housing so the cost must be higher.
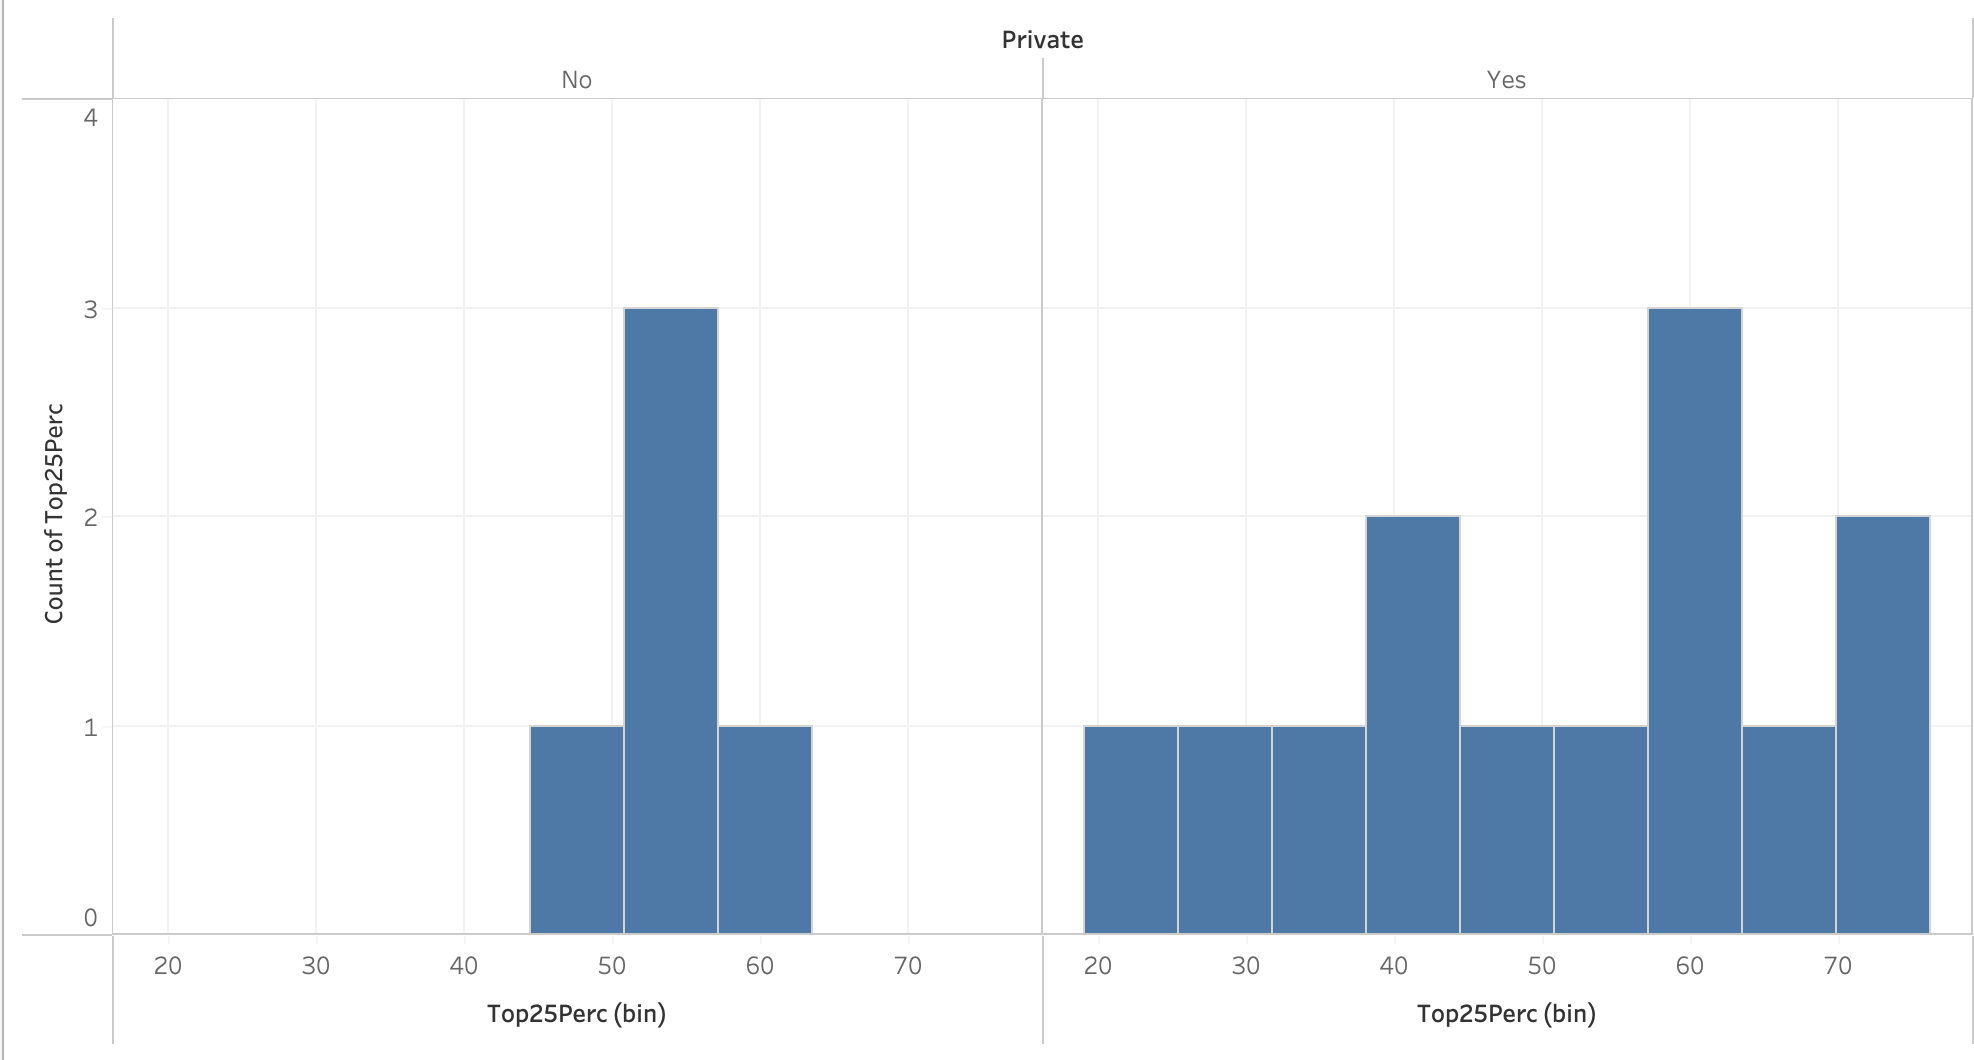
The public schools have a mode number of students who are within the top 25% of their high school of 50-55, while the private schools have a mode number of 60-65. The public schools have a much more concentrated number of students who are within the top 25% of their high school, ranging between 45-65. The range is much broader for the private schools, ranging from 20-75. While this could be due to differences in public schools and private schools, like maybe public schools have stricter rules for acceptance rates, the data is also difficult to analyze here because there are more private schools than public schools. The true cause for this difference is difficult to pinpoint because of the small dataset.